We know for more than 70 years that genes encoded by DNA are transcribed into messenger RNAs and then translated into proteins. But the way our cells functioned turned out to be much more complex. Participating in this complexity and discovered in many eukaryotic organisms in the early 2000s, microRNAs are RNAs that do not code for a protein. These microRNAs, about 22 nucleic acids long, repress and are therefore major regulators of gene expression. Their role has been demonstrated in many physiological and pathological mechanisms. In some cancers, for example, microRNAs are involved in tumor initiation and progression as well as metastasis formation. In humans, 2500 microRNAs are identified. Experimental measurements of their level of expression as well as their functional role generate large amounts of data that are difficult to analyze in the absence of dedicated bioinformatics tools.
In a previous study, IRIG researchers built
MicroRNA networks. The objective was to reuse the mathematical theories developed with the rise of social networks in order to understand the complexity of the links between all human microRNAs. In these microRNA networks, each node (represented by a circle) corresponds to a microRNA; two nodes are linked if the corresponding microRNAs have similarities. The goal of
miRViz is to provide an open access website for all biologists so they can use the power of networks to visually analyze their microRNA data. This new study presents several examples of use involving cancer cells, stem cells or data from cancer patients.
By means of this website, researchers have taken over public data from patients with cortico-adrenal carcinoma and analysed them from a new perspective. They were thus able to visually retrieve the results initially published, without the need for programming expertise. They were also able to demonstrate, for the first time, that the expression of miR-29, a microRNA expressed in these tumours, is a favourable prognostic factor for survival.
Among the properties of
miRViz is its ability to visualize microRNA redundancy (
Figure),
i.e. whether microRNAs that have the same physiological or pathological role are co-expressed.
To date,
miRViz is the only website to offer microRNA data analysis with pre-established networks for 11 different species species (human, mouse, drosophila, etc.).
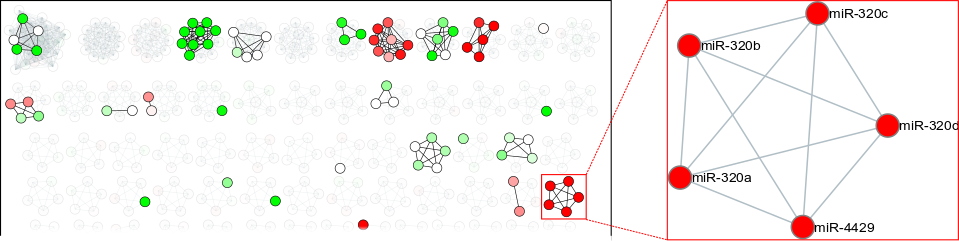
Image extracted from microRNA analysis of cancer cell
exosomes with miRViz.
Each node (represented by a circle) corresponds to a microRNA. In this network, microRNA families can be identified at first glance, and it is noticeable that the expression of microRNAs is not randomly distributed. The miR-320 family, for example, is preferentially exported in the exosomes of colon cancer cells, a preferential export represented by the colour red.
MicroRNA networks: Mathematical and graphical representation where each microRNA is represented by a circle. Two circles are connected if the corresponding microRNAs are neighbors on the DNA or repress similar genes, depending on the chosen array.
Exosomes: Nano-vesicles exported by cells to act as messengers for cell-to-cell communication, and also to evict cellular components from the cell.